We use cookies or similar technologies as specified in our privacy policy to enhance your experience. If
you would like to learn more about how we use cookies, click "Cookie Policy".
Dynamic Mechanical Analysis (DMA) is an advanced technique for measuring viscoelastic properties of materials. With AFM-based DMA, researchers can analyze frequency-dependent viscoelastic behaviors and determine glass transition temperatures at the nanoscale. Unlike bulk DMA methods, AFM-based DMA enables precise targeting of specific regions within a topography image, allowing frequency-dependent DMA measurements to be conducted at exact locations of interest on the sample surface. Park AFM systems integrate advanced DMA capabilities, enabling precise mechanical analysis across various industries, including polymers, biotechnology, and energy storage.
Advantages of Loss Tangent Measurement
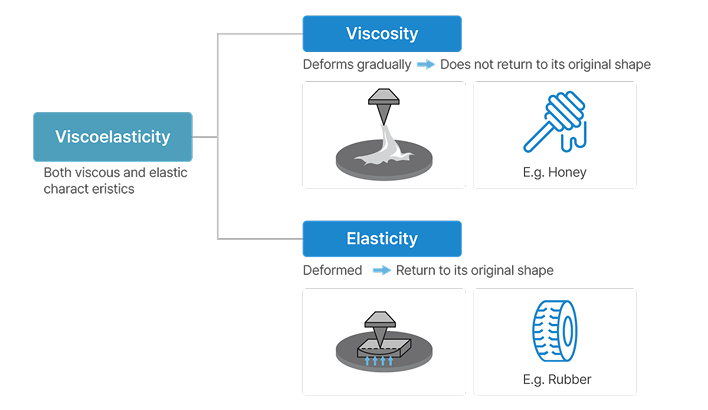
Loss Tangent (Tan δ) is a key parameter obtained from dynamic mechanical analysis (DMA) and is used for characterizing viscoelastic materials.
Park Systems’ AFM-based DMA technology enables precise nanoscale loss tangent measurements
A high tan δ indicates more viscous behavior, while a low tan δ indicates a more elastic response
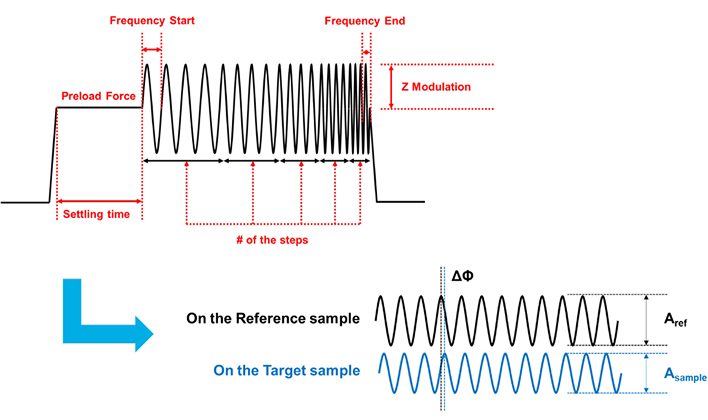
Measurable frequency: 50 Hz – 20 kHz
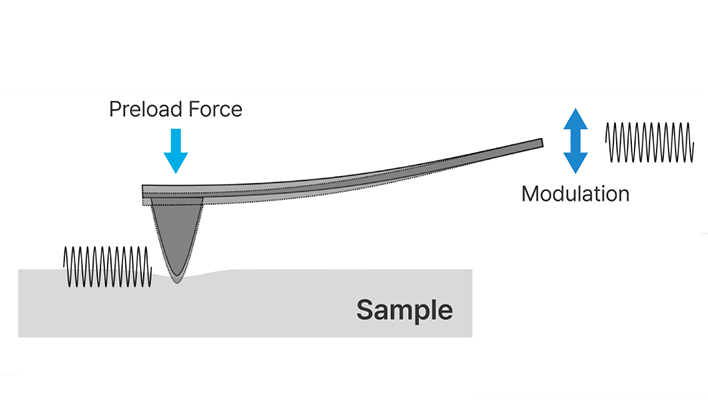
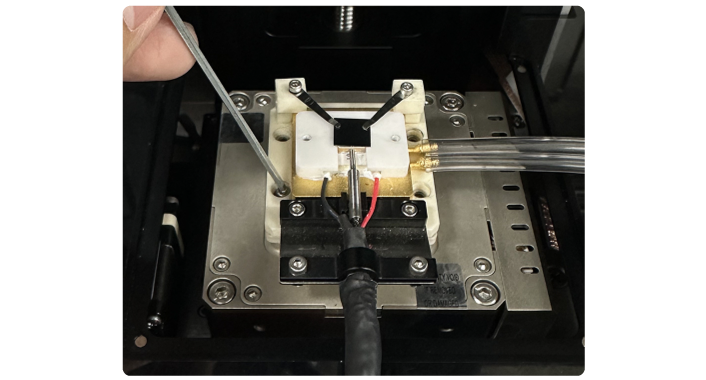
Measured at the nanoscale using AFM tip modulation with a constant force
Loss Tangent measurements provide valuable insights through the following measurement steps
Damping Effect - Reduces response magnitude to applied force
Time Lag - Measures delay in material response
Viscosity Measurement - Compares a material’s viscosity with a reference sample
Temperature-Dependent DMA Measurement
Understanding how materials behave under varying temperatures is crucial for polymer characterization, as it enables detection of Tg (glass transition temperature) by adjusting frequency and temperature range.
Temperature Control Stage 1
Maintains precise surface temperature conditions from -20°C to 170°C
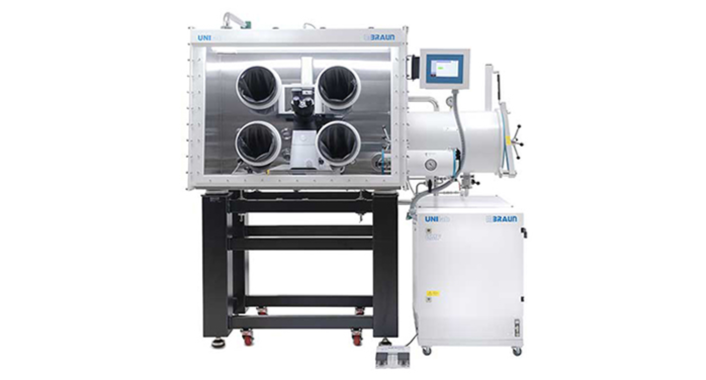
GloveBox (MBraun)
Controls humidity at both high & low temperatures to ensure proper mechanical measurements.
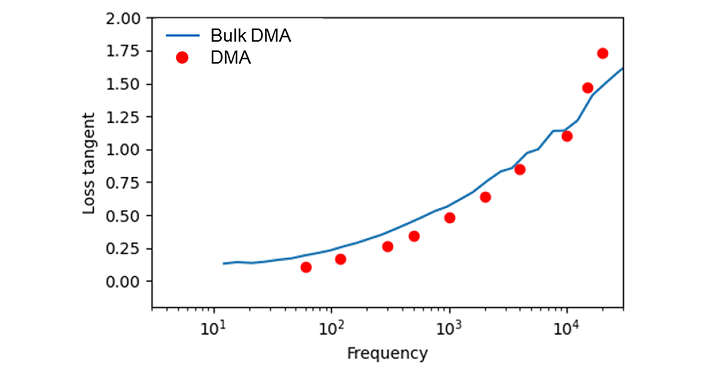
Nanoscale vs. Bulk DMA: Ensuring Data Consistency
Park Systems' DMA has been validated against bulk DMA results, ensuring its accuracy for research purposes
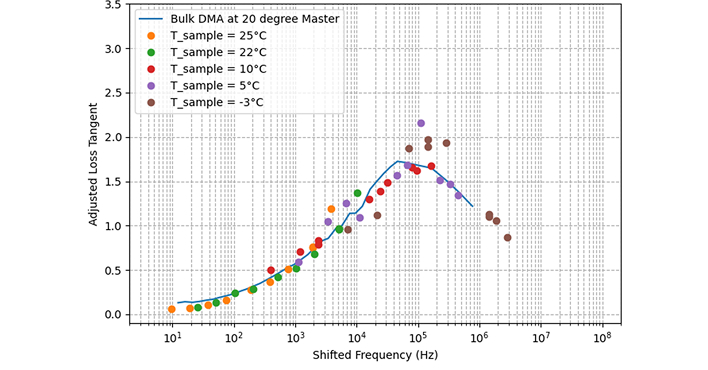
Master curve analysis was successfully conducted to determine the glass transition temperature (Tg) of the SBR sample from temperature-dependent DMA measurements. By applying a temperature-based frequency shift factor, the experimental DMA data for SBR (colored dots) aligned closely with the bulk DMA master curve (blue line)
Applications
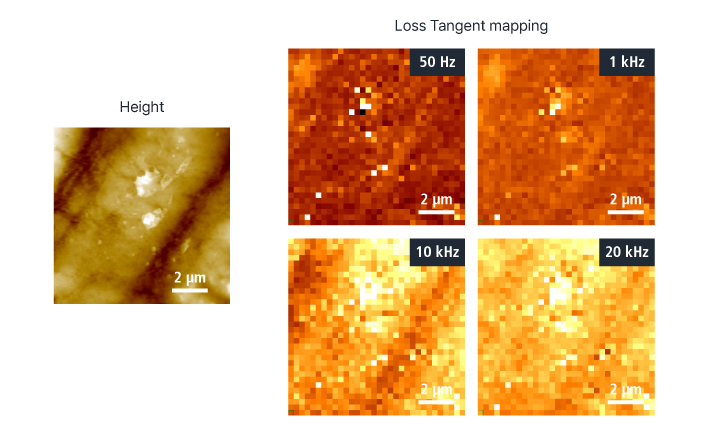
As shown in the mapping image data, when the applied frequency increases, the loss tangent values also increase—evidenced by brighter pixels at higher frequencies. This behavior reflects the viscoelastic properties of the PDMS sample. The inhomogeneity observed in the mapping image is due to both topological effects and the intrinsic variability of the PDMS sample.
High-resolution Mapping of Loss Tangent of PDMS Sample at Varying Frequencies